
East YEG Real Estate Update: What Buyers & Sellers Need to Know This Week (Aug 24, 2026)

East YEG Weekly Market Update
Week Ending August 24, 2026
All statistics below are sourced from REALTORS® Association of Edmonton (RAE) board data, current as of August 24, 2026, 8:28 AM — the exact date and time this week's data export was generated. Figures reflect a snapshot in time and may shift as new activity is reported.
Market Pulse
|
152
Active Listings
Trend starts next week
|
16
Pending Sales
Trend starts next week
|
59
Sold (Last 30 Days)
Trend starts next week
|
2.6
Months of Inventory
Trend starts next week
|
This is the first weekly report, so there's no prior week to compare these four totals against yet. Starting next week, each will show a ▲/▼ arrow reflecting the change from the week before.
Jason's Take
East YEG is holding a fairly balanced pace right now — just under 2.6 months of inventory and a median sale-to-list ratio near 99% tells me well-priced homes are still moving close to asking, but buyers clearly have room to negotiate on the roughly two-thirds of homes that sold under list this month. With over a third of active listings already carrying a price reduction, sellers who price realistically from day one are avoiding that adjustment entirely. If you're weighing whether now's the right time to list or buy in East Edmonton, I'm happy to walk through what these numbers mean for your specific street.
Market Pulse by Home Style
Styles with very few sales in the last 30 days are marked low sample — treat those months-of-inventory figures as a rough signal, not a firm read.
| Style | Active | Pending | Sold (30d) | Months Inv. |
| Detached Single Family | ||||
| Bungalow | 73 | 8 | 35 | 2.1 |
| 2 Storey | 32 | 6 | 7 | 4.6 |
| 1 & Half Storey | 6 | 0 | 3 | 2.0 (low sample) |
| Raised Bungalow | 6 | 0 | 1 | 6.0 (low sample) |
| Bi-Level | 5 | 0 | 0 | — |
| 2 & Half Storey | 4 | 0 | 0 | — |
| 3 Storey | 3 | 0 | 1 | 3.0 (low sample) |
| 4 Level Split | 2 | 1 | 0 | — |
| 5 Level Split | 1 | 0 | 0 | — |
| Condo | ||||
| Single Level Apartment | 10 | 1 | 11 | 0.9 |
| 2 Storey | 4 | 0 | 0 | — |
| 3 Storey | 1 | 0 | 0 | — |
| Multi Level Apartment | 0 | 0 | 1 | 0.0 (low sample) |
What Changed This Week
- ▼ 17 new listings hit the market, down from 22 the previous week.
- ▼ 12 homes sold in the last 7 days, compared to 13 the week before — a fairly steady pace.
- 34 listings have left the market unsold in the last 30 days (19 terminated, 15 expired) — worth watching if that trend continues, as it can signal pricing resistance.
Pricing: What Are Buyers Actually Paying?
Median is the more reliable number to watch here — East YEG inventory includes everything from condos to multi-unit infill, and a handful of high-value properties can easily skew a simple average.
| Segment | Median Sold Price |
| All East YEG (30 days) | $479,000 |
| Detached Single Family | $506,500 |
| Condo | $231,450 |
Detached Single Family, by Style
| Bungalow | $485,000 | n=35 |
| 2 Storey | $660,000 | n=7 |
| 3 Storey | $799,900 | n=1, low sample |
| 1 & Half Storey | $491,000 | n=3, low sample |
| Raised Bungalow | $365,000 | n=1, low sample |
| Bi-Level, 2.5 Storey, 4 Level Split, 5 Level Split | No sales this period |
Condo, by Style
| Single Level Apartment | $198,000 | n=11 |
| Multi Level Apartment | $325,000 | n=1, low sample |
| 2 Storey, 3 Storey | No sales this period |
How Much Are Buyers Negotiating?
Median sale-to-list ratio: 98.7%
Over the last 30 days: 24% of homes sold above asking, 8% sold right at asking, and 68% sold below their final list price. That's useful context for both sides — sellers pricing realistically are still finding buyers close to ask, but the majority of transactions still involve some negotiation.
How Fast Are Homes Selling?
Median Days on Market: 19 days across East YEG over the last 30 days.
Price Reduction Watch
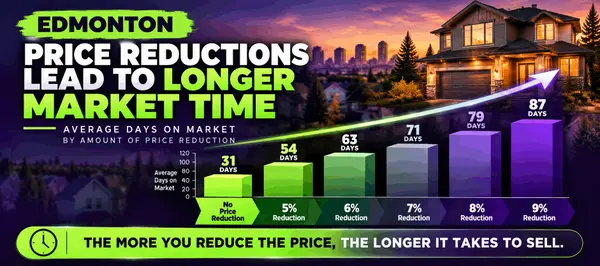
34.9% of current active listings (53 of 152) have already reduced their asking price at least once, with a median reduction of $20,900. That's a meaningful share of the market — worth knowing whether you're pricing a home to sell or watching for a buying opportunity.
East YEG Neighbourhood Leaderboard
Based on 30-day activity, using communities with enough sales for a meaningful comparison.
| Category | Neighbourhood |
| Most Active Market (30-day sales) | Ottewell — 12 sales |
| Fastest-Selling | Kenilworth — 12.5 day median DOM |
| Strongest Seller Negotiating Position | Avonmore — 103.3% median sale-to-list ratio |
New This Week in East YEG
17 new listings hit the market across East YEG this week. A few worth a closer look:
Ottewell — $279,000
$241.07/sq ft — the most affordable price-per-square-foot among this week's new East YEG listings.
Bonnie Doon — $699,000
Confirmed legal secondary suite — a strong option for buyers considering mortgage-helper income.
Bonnie Doon — 8860 93 ST NW — $760,000
Shows as 3 days on market. In reality, this home first listed April 27 at $860,000, sat for 108 days before coming off market, and returned August 21 at a $100,000 lower price. True time trying to sell: roughly 4 months.
Of this week's 17 new listings, 4 are properties returning to market after a previous listing was terminated or expired — their advertised days-on-market resets, but their real history doesn't. Across all of East YEG right now, roughly 9% of active listings fall into this same category. Worth knowing whether you're evaluating a "new" listing or negotiating on one that's already tested the market once.
Thinking About Selling in East YEG?
What Would It Take to Get Top Dollar for Your Home?
Between negotiation trends, price reductions, and how fast homes are actually moving right now, the numbers above only tell part of the story. I'll give you a straight answer on what your specific home is worth today, and what it would take to maximize your sale price in this market.
Get Your Free Home Valuation Book a Free Strategy CallWhat Did Homes Near Me Sell For in East YEG?
The pricing and market statistics above come from aggregated board data, but individual sold prices and addresses aren't something I can publish directly here — that's a REALTORS® Association of Edmonton requirement, not a restriction I'm choosing to put in place. Recently sold homes and their sale prices are available through my website with a free account.
Browse recently sold homes by neighbourhood:
This Week's East YEG Questions, Answered
These rotate weekly based on that week's real activity — figures are aggregate board stats, current as of the date at the top of this post.
What is the East YEG real estate market like right now?
East YEG is holding a fairly balanced pace, with 2.6 months of inventory and a median sale-to-list ratio of 98.7% across the last 30 days.
How many homes sold in Ottewell in the last 30 days?
12 homes sold in Ottewell over the last 30 days — the most active East YEG community this period — at a median sold price of $539,950.
What is the average asking price in Forest Heights?
The median active list price in Forest Heights is currently $574,500.
What did homes sell for in Gold Bar?
4 homes sold in Gold Bar over the last 30 days, at a median price of $450,500.
How fast are homes selling in Kenilworth?
Kenilworth is the fastest-selling East YEG community this period, with a median of 12.5 days on market.
Jason Beattie, REALTOR®
eXp Realty · 780-791-9633 · Jason.Beattie@eXpRealty.com
Categories
- All Blogs (96)
- downsizing (16)
- East YEG (49)
- Eco-friendly Homes (1)
- Edmonton Bylaws (5)
- Events & Community News (36)
- First Time Home Buyer (36)
- Gardening & Landscaping (1)
- Home Buying Tips (50)
- Home Insurance (5)
- Home Selling Tips (39)
- How to (14)
- increase home value (15)
- Interior Design (2)
- Local Market Trends (59)
- market Influences (69)
- Market Update (48)
- Migration (4)
- Mortgage Info (4)
- Moving & Relocation (63)
- Neighborhood Profiles (50)
- Real Estate FAQs (81)
- Real Estate Investment (8)
- Real Estate Laws & Regulations (4)
- Technology in Real Estate (2)
Recent Posts



"With 25+ years in Edmonton real estate, I track weekly sales activity across all 13 East YEG neighbourhoods so buyers and sellers get real numbers, not guesswork. If you're weighing a move in East Edmonton, I'm happy to walk you through what the data means for your street."