
East YEG Real Estate Update: What Buyers & Sellers Need to Know This Week (September 28, 2026)

East YEG Weekly Market Update
Week Ending September 28, 2026
Data reflects board records as of September 28, 2026, 7:28 AM (most recent Input Date in the dataset). Figures below are a snapshot as of that date and time and may shift as new records are entered. Sold records in this export run through September 24, 2026, so any sales after that date are not yet reflected. Figures cover all 17 East YEG neighbourhoods (East YEG, also known as East Edmonton).
Note: this week's export covers the last 90 days, the same as last week, so terminated + expired totals and the relist percentage are directly comparable week over week. Sold, pricing, negotiation and inventory figures use a consistent 30-day sold window.
|
216
Active Listings
▲ up 3 from last week
|
28
Pending
▼ down 3 from last week
|
63
Sold (30 Days)
▲ up 6 from last week
|
3.43
Months of Inventory
▼ down from 3.74
|
BT Group East YEG Market Research is prepared by Jason Beattie, REALTOR® with eXp Realty, using current REALTORS® Association of Edmonton MLS® market activity across the East YEG neighbourhoods tracked in this report. Short-term neighbourhood statistics can fluctuate when relatively few properties sell; individual property values should not be inferred from neighbourhood averages alone.
Jason's Take, DRAFT, needs your review and edit before publishing
"Months of inventory eased back from 3.74 to 3.43 this week, and sales in the last 30 days rose from 57 to 63, so buyers are still finding homes to buy. The part I'm watching is that 37.5% of active listings now carry a price reduction, up from 35.2%, and the median home is taking 20 days to sell instead of 18. Bungalows are running at 2.47 months of inventory while two storey homes sit at 4.25, so the type of home you're selling matters as much as the neighbourhood. If you're listing a two storey, price it right from day one, because the first 10 days are when your home gets the most attention."
Market Pulse by Home Style
Detached Single Family
Active: 179 | Pending: 25 | Sold (30d): 51 | Months of Inventory: 3.51
| Style | Active | Pending | Sold (30d) | Months Inv. |
| Bungalow | 89 | 13 | 36 | 2.47 |
| 2 Storey | 51 | 9 | 12 | 4.25 |
| 1 & Half Storey | 8 | 0 | 1 (low sample) | 8.00 |
| Raised Bungalow | 8 | 1 (low sample) | no sales this period | N/A |
| Bi-Level | 5 | 0 | no sales this period | N/A |
| 4 Level Split | 4 (low sample) | 0 | no sales this period | N/A |
| 2 & Half Storey | 3 (low sample) | 0 | no sales this period | N/A |
| 3 Storey | 2 (low sample) | 1 (low sample) | 1 (low sample) | 2.00 |
| Other styles (splits, hillside) | 2 (low sample) | 0 | 1 (low sample) | N/A |
| Style not yet entered | 7 | 1 (low sample) | 0 | N/A |
Condo
Active: 37 | Pending: 3 | Sold (30d): 12 | Months of Inventory: 3.08
| Style | Active | Pending | Sold (30d) | Months Inv. |
| Single Level Apartment | 28 | 2 (low sample) | 10 | 2.80 |
| Multi Level Apartment | 3 (low sample) | 0 | 1 (low sample) | 3.00 |
| 2 Storey | 3 (low sample) | 0 | 1 (low sample) | 3.00 |
| 3 Storey | 2 (low sample) | 0 | no sales this period | N/A |
| 2 & Half Storey | 1 (low sample) | 1 (low sample) | no sales this period | N/A |
What Changed This Week
- New Listings: 21 in the last 7 days (September 22 to 28), down from 30 the 7 days before.
- Sold: 8 in the same 7 days, down from 20 the 7 days before. Sold records in this export run through September 24, so the most recent days may still be filling in.
- Terminated + Expired: 143 combined in the last 90 days (78 terminated, 65 expired), compared with 145 last week. Median time on market before coming off sits at 81 days (74 last week), and 60 of those properties sat 90 days or more before coming off (57 last week).
Pricing
Overall median sold price: $427,000 (63 homes)
Detached Single Family median: $482,000 (51 homes)
- Bungalow: $427,750 (36 homes)
- 2 Storey: $657,500 (12 homes)
- 1 & Half Storey: $515,000 (1 home, low sample)
- 3 Storey: $820,000 (1 home, low sample)
- Hillside Bungalow: $800,000 (1 home, low sample)
Condo median: $260,000 (12 homes)
- Single Level Apartment: $247,500 (10 homes)
- 2 Storey: $517,000 (1 home, low sample)
- Multi Level Apartment: $385,000 (1 home, low sample)
The overall median moved down from $460,000 last week, while the detached median held nearly flat ($482,000 vs $483,000). With only 63 sales in the window, a shift in the mix of homes sold (more bungalows and condos) can move the overall median on its own, so it is not necessarily a change in what any one home is worth.
Negotiation
Median sale-to-list ratio: 98.00% (63 homes)
15.9% of sales closed over asking, 3.2% closed exactly at asking, and 81.0% closed under asking.
Speed
Median Days on Market (sold, last 30 days): 20 days (63 homes), up from 18 last week.
Price Reduction Watch
37.5% of active listings (81 of 216) have been reduced from their original list price, up from 35.2% last week.
Median reduction amount: $21,000
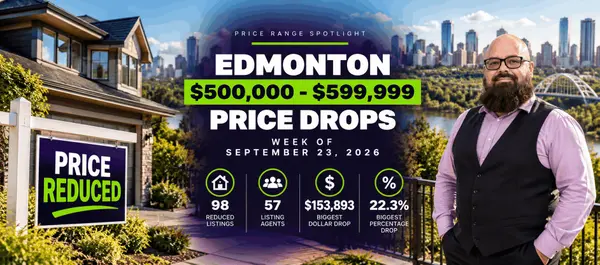
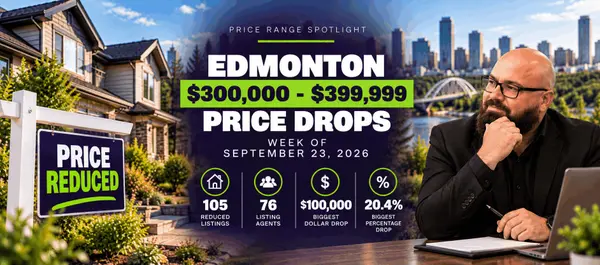
If your own listing has been sitting without much activity, The Kiss of Death breaks down what your first 7 to 10 days on market actually told you, and whether a correction or a reduction is the right move now. For the citywide picture, see Edmonton Price Drops: Week of September 23, 2026.
East YEG Neighbourhood Leaderboard
30-day window across all 17 East YEG neighbourhoods. Neighbourhoods need 3+ sales to qualify.
| Category | Neighbourhood | Stat |
| Most Active | Ottewell | 12 sales in 30 days |
| Fastest-Selling | Terrace Heights | 6-day median DOM (3 sales) |
| Strongest Seller Negotiating Position | Terrace Heights | 100.03% median sale-to-list (3 sales) |
New Listings Spotlight
#305 8730 82 Ave NW, Bonnie Doon, $299,900
Single Level Apartment, Built 2009
LOWEST $/SQ FT THIS WEEK7501 95 Ave NW, Holyrood, $599,900
Bungalow, Built 1956, Legal basement suite (2nd Suite Permit confirmed by seller)
LEGAL BASEMENT SUITE8136 77 Ave NW, King Edward Park, $749,900
2 Storey, Built 2026
NEW CONSTRUCTION RELISTED, NOT NEW5204 97A Ave NW, Ottewell, $514,900
Bungalow, Built 1959
RELISTED, NOT NEW7704 104 Ave NW, Forest Heights, $500,000
Bungalow, Built 1957
RELISTED, NOT NEWAggregate note: 20.4% of current active East YEG inventory (44 of 216 listings) is a relist, up from 19.7% last week, and 6 of the 19 new active listings in the last 7 days were relists. If you're weighing whether to relist a home that came off the market, What Happens If My Listing Expires Without Selling? walks through the real options.
Thinking About Selling in East YEG?
What Would It Take to Get Top Dollar for Your Home?
Between negotiation trends, price reductions, and how fast homes are actually moving right now, the numbers above only tell part of the story. I'll give you a straight answer on what your specific home is worth today, and what it would take to maximize your sale price in this market.
Get Your Free Home Valuation Book a Free Strategy CallWhat Did Homes Near Me Sell For in East YEG?
Individual sold prices aren't published in this post. Viewing actual sold prices requires a free sign-in. This is a REALTORS® Association of Edmonton (RAE) requirement, not a restriction Jason is choosing to impose. Sign in below to see sold listings for any of the 17 East YEG neighbourhoods.
Frequently Asked Questions
What is the East YEG real estate market like right now?
As of September 28, 2026, East YEG has 216 active listings, 28 pending, and 63 sales in the last 30 days, working out to about 3.43 months of inventory. The median sold price across all property types is $427,000, homes are selling at a median 98.00% of list price, and the median sale takes about 20 days on market.
Which East YEG neighbourhood is the most active right now?
Ottewell leads East YEG this period with 12 sales in the last 30 days, more than any of the other 16 communities.
Where are homes selling fastest in East YEG this week?
Terrace Heights posted the quickest turnaround this period, with a median of 6 days on market across 3 sales, the fastest pace among East YEG communities with enough sales to measure reliably.
Which East YEG neighbourhood has the highest share of price-reduced listings?
Capilano is highest this week, with 4 of its 5 active listings (80%) reduced from their original list price, though that is a small sample. Among neighbourhoods with more inventory, Hazeldean is highest at 57.1% (8 of 14), after leading East YEG for the three weeks before this one.
What does the Ritchie market look like right now?
Ritchie has 19 active listings and posted 6 sales in the last 30 days, with a median of 35.5 days on market and a 97.85% median sale-to-list ratio. Only 21.1% of its active listings (4 of 19) have been reduced, the lowest share among East YEG neighbourhoods with 5 or more active listings.
Jason Beattie
REALTOR® | eXp Realty | BT Group
780-791-9633 | Jason.Beattie@eXpRealty.com
Book a Free Strategy Call
Categories
- All Blogs (75)
- downsizing (10)
- East YEG (32)
- Eco-friendly Homes (1)
- Edmonton Bylaws (3)
- Events & Community News (24)
- First Time Home Buyer (24)
- Gardening & Landscaping (1)
- Home Buying Tips (38)
- Home Insurance (5)
- Home Selling Tips (32)
- How to (14)
- increase home value (15)
- Interior Design (2)
- Local Market Trends (43)
- market Influences (51)
- Market Update (40)
- Migration (4)
- Mortgage Info (3)
- Moving & Relocation (44)
- Neighborhood Profiles (33)
- Real Estate FAQs (60)
- Real Estate Investment (6)
- Real Estate Laws & Regulations (4)
- Technology in Real Estate (2)
Recent Posts








"With 25+ years in Edmonton real estate, I track weekly sales activity across all 13 East YEG neighbourhoods so buyers and sellers get real numbers, not guesswork. If you're weighing a move in East Edmonton, I'm happy to walk you through what the data means for your street."