
East YEG Real Estate Update: What Buyers & Sellers Need to Know This Week (November 2, 2026)

East YEG Weekly Market Update
Week Ending November 2, 2026
Data reflects board records as of November 2, 2026, 8:09 AM (when this export was pulled). Figures below are a snapshot as of that date and time and may shift as new records are entered. The most recent record entry in the dataset is from Monday, November 2, 2026, and sold records run through October 31, 2026, so any later sales are not yet reflected. Figures cover all 17 East YEG neighbourhoods (East YEG, also known as East Edmonton).
Note: the previous update was published October 26, 2026, so "last update" comparisons below are against October 26, one week ago. This week's export covers the last 90 days, the same as prior updates, so terminated + expired totals and the relist percentage are directly comparable. Weekly new-listing and sold counts are recounted from this week's file for both weeks, so they may differ slightly from the counts published last week. Sold, pricing, negotiation and inventory figures use a consistent 30-day sold window (October 1 to October 31).
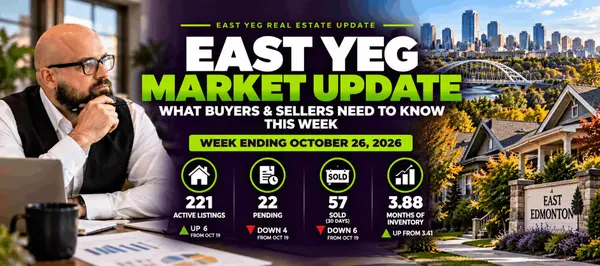
|
200
Active Listings
▼ down 21 from Oct 26
|
28
Pending
▲ up 6 from Oct 26
|
49
Sold (30 Days)
▼ down 8 from Oct 26
|
4.08
Months of Inventory
▲ up from 3.88
|
BT Group East YEG Market Research is prepared by Jason Beattie, REALTOR® with eXp Realty, using current REALTORS® Association of Edmonton MLS® market activity across the East YEG neighbourhoods tracked in this report. Short-term neighbourhood statistics can fluctuate when relatively few properties sell; individual property values should not be inferred from neighbourhood averages alone.
Jason's Take
"Inventory shrank this week, but not because demand got stronger. Active listings fell 21 to 200 while sales slowed too, with only 7 homes sold in the 7 days ending October 31 compared with 13 the week before, so months of inventory still rose from 3.88 to 4.08. A lot of that shrinking is homes coming off the market without selling: 160 listings were terminated or expired in the last 90 days, and 65 of them sat 90 days or more first. Add the Bank of Canada's October 28 move to 2.5%, its first increase since July 2023, and buyers are watching payments as well as prices. Homes are still selling, at a median 97.53% of list price in about 30 days, so the sellers getting results are the ones who priced to today's buyer from day one."
Market Pulse by Home Style
Detached Single Family
Active: 163 | Pending: 22 | Sold (30d): 44 | Months of Inventory: 3.70
| Style | Active | Pending | Sold (30d) | Months Inv. |
| Bungalow | 82 | 8 | 27 | 3.04 |
| 2 Storey | 47 | 9 | 8 | 5.88 |
| 1 & Half Storey | 8 | 2 (low sample) | 1 (low sample) | 8.00 |
| Raised Bungalow | 8 | 1 (low sample) | 2 (low sample) | 4.00 |
| 2 & Half Storey | 3 (low sample) | 0 | no sales this period | N/A |
| 3 Storey | 3 (low sample) | 0 | no sales this period | N/A |
| 4 Level Split | 2 (low sample) | 0 | 3 (low sample) | 0.67 |
| Other styles (Bi-Level, 3 Level, Hillside and 5 Level splits) | 2 (low sample) | 1 (low sample) | 2 (low sample) | 1.00 |
| Style not yet entered | 8 | 1 (low sample) | 1 (low sample) | 8.00 |
Condo
Active: 37 | Pending: 6 | Sold (30d): 5 | Months of Inventory: 7.40
| Style | Active | Pending | Sold (30d) | Months Inv. |
| Single Level Apartment | 26 | 5 | 5 (low sample) | 5.20 |
| Multi Level Apartment | 3 (low sample) | 0 | no sales this period | N/A |
| 2 Storey | 3 (low sample) | 1 (low sample) | no sales this period | N/A |
| 2 & Half Storey, 3 Storey and Bungalow | 5 (low sample) | 0 | no sales this period | N/A |
What Changed This Week
- New Listings: 16 in the last 7 days (October 26 to November 1), compared with 21 the 7 days before.
- Sold: 7 in the 7 days ending October 31, compared with 13 the 7 days before. Sold records in this export run through October 31, so the most recent days may still be filling in.
- Terminated + Expired: 160 combined in the last 90 days (86 terminated, 74 expired), compared with 154 on October 26. Median time on market before coming off sits at 75.5 days (71.5 on October 26), and 65 of those properties sat 90 days or more before coming off (59 on October 26).
Pricing
Overall median sold price: $427,000 (49 homes)
Detached Single Family median: $433,750 (44 homes)
- Bungalow: $414,000 (27 homes)
- 2 Storey: $619,700 (8 homes)
- 4 Level Split: $665,000 (3 homes, low sample)
- 1 & Half Storey: $633,000 (1 home, low sample)
- 5 Level Split: $532,500 (1 home, low sample)
- Raised Bungalow: $504,500 (2 homes, low sample)
- Bi-Level: $383,000 (1 home, low sample)
Condo median: $195,000 (5 homes, all Single Level Apartments)
The overall median eased from $430,000 on October 26 to $427,000. The detached median fell from $482,500 to $433,750, but most of that is the mix of homes that sold: 8 two-storey homes sold this period compared with 10 last week, at a median of $619,700 compared with $762,250, while the bungalow median moved from $429,000 to $414,000. The condo median fell from $209,000 to $195,000 on only 5 sales, a small enough sample that a few sales can move it. The Bank of Canada raised its overnight rate to 2.5% on October 28, and Bank of Canada Raises Rates to 2.5% explains what it could mean for Edmonton homeowners and sellers. For the buyer's view of payments, see Fixed Mortgage Rates Are Climbing in Canada.
Negotiation
Median sale-to-list ratio: 97.53% (49 homes), compared with 97.57% on October 26.
14.3% of sales closed over asking, 4.1% closed exactly at asking, and 81.6% closed under asking.
Speed
Median Days on Market (sold, last 30 days): 30 days (49 homes), up from 26 on October 26.
Price Reduction Watch
37.5% of active listings (75 of 200) have been reduced from their original list price, down from 40.3% on October 26.
Median reduction amount: $20,000, down from $23,000 on October 26.
If your own listing has been sitting without much activity, The Kiss of Death breaks down what your first 7 to 10 days on market actually told you. To see what overpricing costs in time, read Does Overpricing Your Edmonton Home Cost You Time?
East YEG Neighbourhood Leaderboard
30-day window across all 17 East YEG neighbourhoods. Neighbourhoods need 3+ sales to qualify.
| Category | Neighbourhood | Stat |
| Most Active | Forest Heights | 8 sales in 30 days |
| Fastest-Selling | King Edward Park | 13-day median DOM (3 sales) |
| Strongest Seller Negotiating Position | King Edward Park | 99.91% median sale-to-list (3 sales) |
New Listings Spotlight
9359 92 St NW, Strathearn, $319,888
Bungalow, Built 1930
LOWEST-PRICED NEW HOUSE THIS WEEKRELISTED, NOT NEW6403 94B Ave NW, Ottewell, $398,800
Bungalow, Built 1961
LOWEST $/SQ FT OF ANY NEW LISTING THIS WEEK9743 70 Ave NW, Hazeldean, $675,000
Raised Bungalow, Built 1952, secondary suite (2nd Suite Permit confirmed by seller)
SECONDARY SUITE10625 42 St NW, Gold Bar, $825,000
2 Storey, Built 2021
HIGHEST-PRICED NEW LISTING THIS WEEK5604 and 5606 105 Ave NW, Fulton Place, $687,900 and $755,000
Two 2 Storey homes, Built 2025 and 2026
BOTH RELISTED, NOT NEWAggregate note: 24.5% of current active East YEG inventory (49 of 200 listings) is a relist, compared with 24.9% on October 26, and 6 of the 15 new active listings in the last 7 days were relists. If you're weighing whether to relist a home that came off the market, What Happens If My Listing Expires Without Selling? walks through the real options.
Thinking About Selling in East YEG?
What Would It Take to Get Top Dollar for Your Home?
Between negotiation trends, price reductions, and how fast homes are actually moving right now, the numbers above only tell part of the story. I'll give you a straight answer on what your specific home is worth today, and what it would take to maximize your sale price in this market.
Get Your Free Home ValuationBook a Free Strategy CallWhat Did Homes Near Me Sell For in East YEG?
Individual sold prices aren't published in this post. Viewing actual sold prices requires a free sign-in. This is a REALTORS® Association of Edmonton (RAE) requirement, not a restriction Jason is choosing to impose. Sign in below to see sold listings for any of the 17 East YEG neighbourhoods.
Frequently Asked Questions
What is the East YEG real estate market like right now?
As of November 2, 2026, East YEG has 200 active listings, 28 pending, and 49 sales in the last 30 days, working out to about 4.08 months of inventory. The median sold price across all property types is $427,000, homes are selling at a median 97.53% of list price, and the median sale takes about 30 days on market.
Which East YEG neighbourhood is the most active right now?
Forest Heights had the most sales in East YEG this period, with 8 sales in the last 30 days, ahead of Bonnie Doon with 7 and Ottewell with 6.
Where are homes selling fastest in East YEG this week?
King Edward Park posted the quickest turnaround among East YEG communities with at least 3 sales, a median of 13 days on market across 3 sales. Holyrood was next at 24 days across 4 sales, followed by Ottewell at 26 days across 6 sales.
Which East YEG neighbourhood has the highest share of price-reduced listings?
Among neighbourhoods with at least 5 active listings, Capilano is highest, with 3 of its 5 active listings (60.0%) reduced from their original list price. Among neighbourhoods with 10 or more active listings, Forest Heights is highest at 11 of 21 (52.4%), and Forest Heights and Bonnie Doon tie for the most reduced listings by count at 11 each (Bonnie Doon is 11 of 24, or 45.8%).
What does the Cloverdale market look like right now?
Cloverdale has 10 active listings and recorded no sales in the 30 days from October 1 to October 31, 2026. 4 of its 10 active listings (40.0%) have been reduced from their original list price.
Jason Beattie
REALTOR® | eXp Realty | BT Group
780-791-9633 | Jason.Beattie@eXpRealty.com
Book a Free Strategy CallCategories
- All Blogs (113)
- downsizing (17)
- East YEG (63)
- Eco-friendly Homes (1)
- Edmonton Bylaws (6)
- Events & Community News (43)
- First Time Home Buyer (40)
- Gardening & Landscaping (1)
- Home Buying Tips (55)
- Home Insurance (5)
- Home Selling Tips (46)
- How to (16)
- increase home value (16)
- Interior Design (2)
- Local Market Trends (71)
- market Influences (80)
- Market Update (54)
- Migration (7)
- Mortgage Info (8)
- Moving & Relocation (74)
- Neighborhood Profiles (54)
- Real Estate FAQs (93)
- Real Estate Investment (11)
- Real Estate Laws & Regulations (5)
- Technology in Real Estate (2)
Recent Posts









"With 25+ years in Edmonton real estate, I track weekly sales activity across all 17 East YEG neighbourhoods so buyers and sellers get real numbers, not guesswork. If you're weighing a move in East Edmonton, I'm happy to walk you through what the data means for your street."